The associated model and definition demonstrating the use of this component can be downloaded here.
Flow Catchments
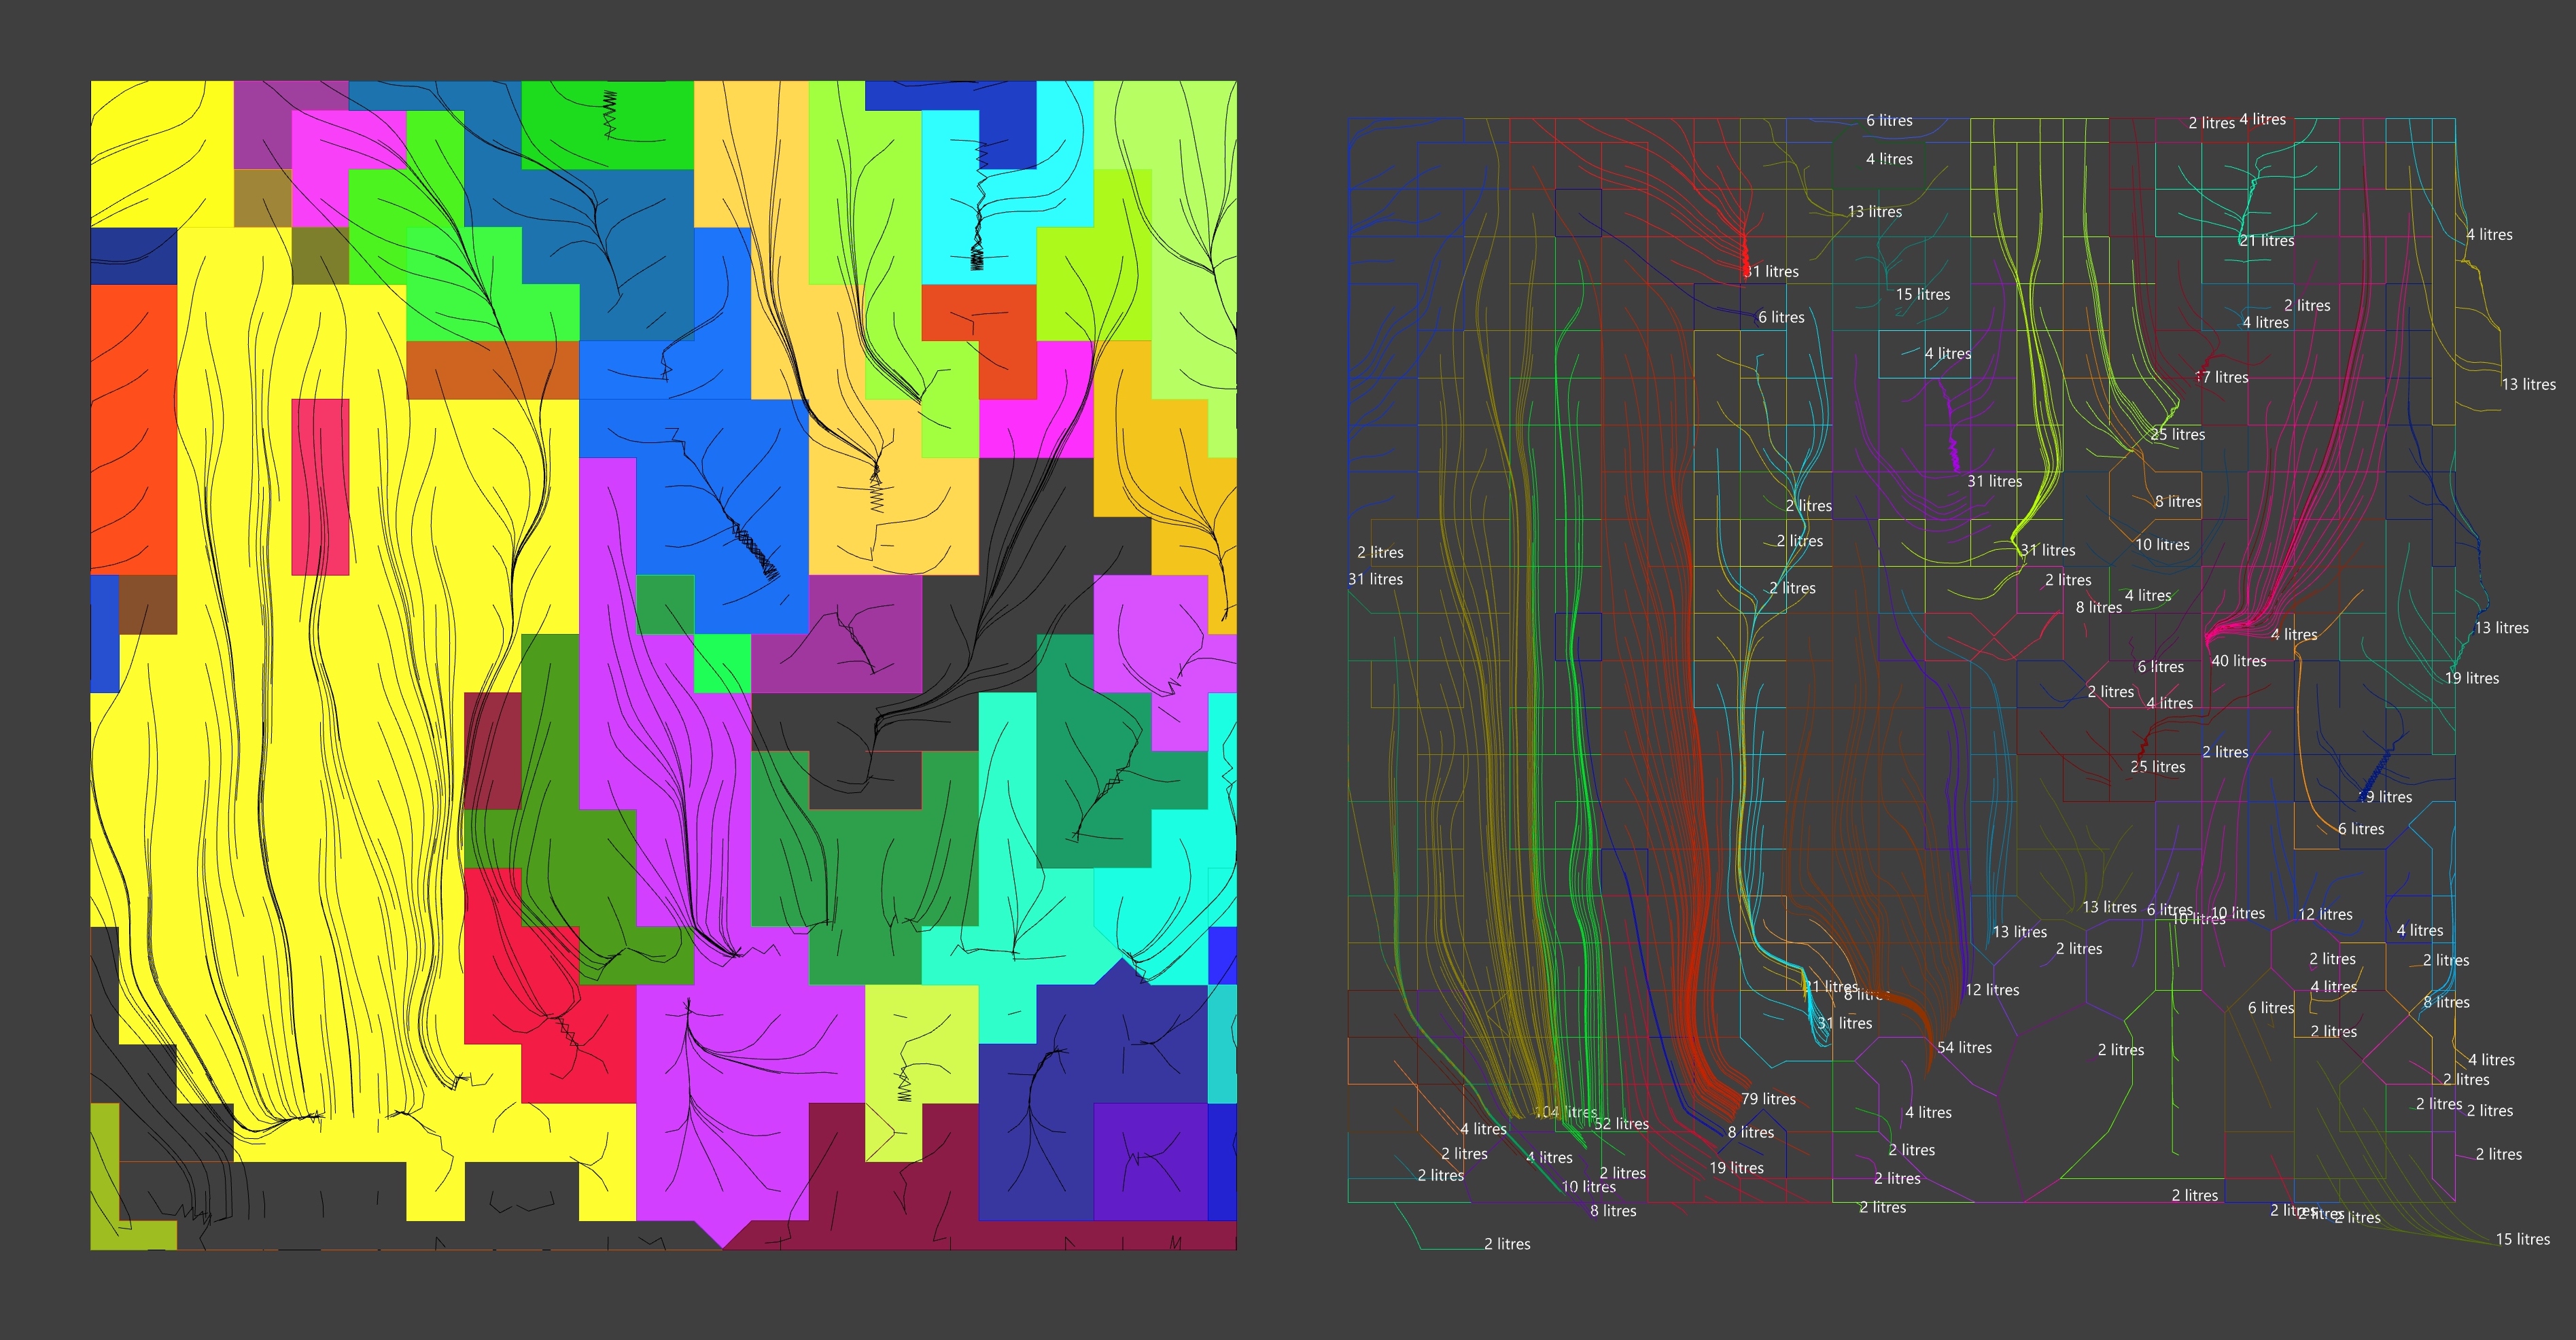
Using surface water flow paths to display catchment areas.
The FlowCatchment component uses the collection of pre-calculated flow paths to identify different catchment areas. To do so, it classifies each flow path into groups depending upon which paths finish or ‘drain’ into the same approximate location.
This grouping is visually represented using a Voronoi diagram with each cell centred on the original Pts used as the ‘start’ of each flow path. Once formed, adjacent Voronoi cells whose origins drain to the same end location are joined together to form ‘catchment’ boundaries. Additionally, the different catchment groups are provided with a distinct color code and their cells/paths are output as distinct branches to aid further visualisation or analysis.
Note that this is a very limited form of catchment/watershed/basin identification as the flow paths only measure the effects of topography on surface water flows; ignoring other factors. The formed catchments may also be overly specific, as the flow paths tend to form false endorheic basins depending on the smoothness of the terrain geometry and the precision of the flow fidelity parameter.
Each catchment type is assigned a “volume” figure, which represents the proportion of flow paths that end within that catchment. For instance, a catchment that 22 of 50 flow paths end inside would have a corresponding volume % of 0.44. This number can then be multiplied by whatever volumetric load the flow paths represent.
Icon
Identify the catchments within a set of flow paths
| Mode | Name | ID | Description | Optional | Type |
|---|---|---|---|---|---|
| Flow Paths |
C
|
The flow paths as generated by the flows component |
CurveParameter
|
||
| Proximity Threshold |
T
|
The distance between end points required to form a catchment |
NumberParameter
|
||
| Catchments |
B
|
The catchment boundaries identified |
CurveParameter
|
||
| Flow Paths |
P
|
The flow paths grouped by catchment |
CurveParameter
|
||
| Color Codes |
C
|
Colour codes the uniquely identify each path and boundary |
ColourParameter
|
||
| Volume %s |
V
|
The % of the total flow paths that drain to this area |
NumberParameter
|
Workflows and Examples
The example file for this component demonstrates a number of options for visualisation and extension, such as:
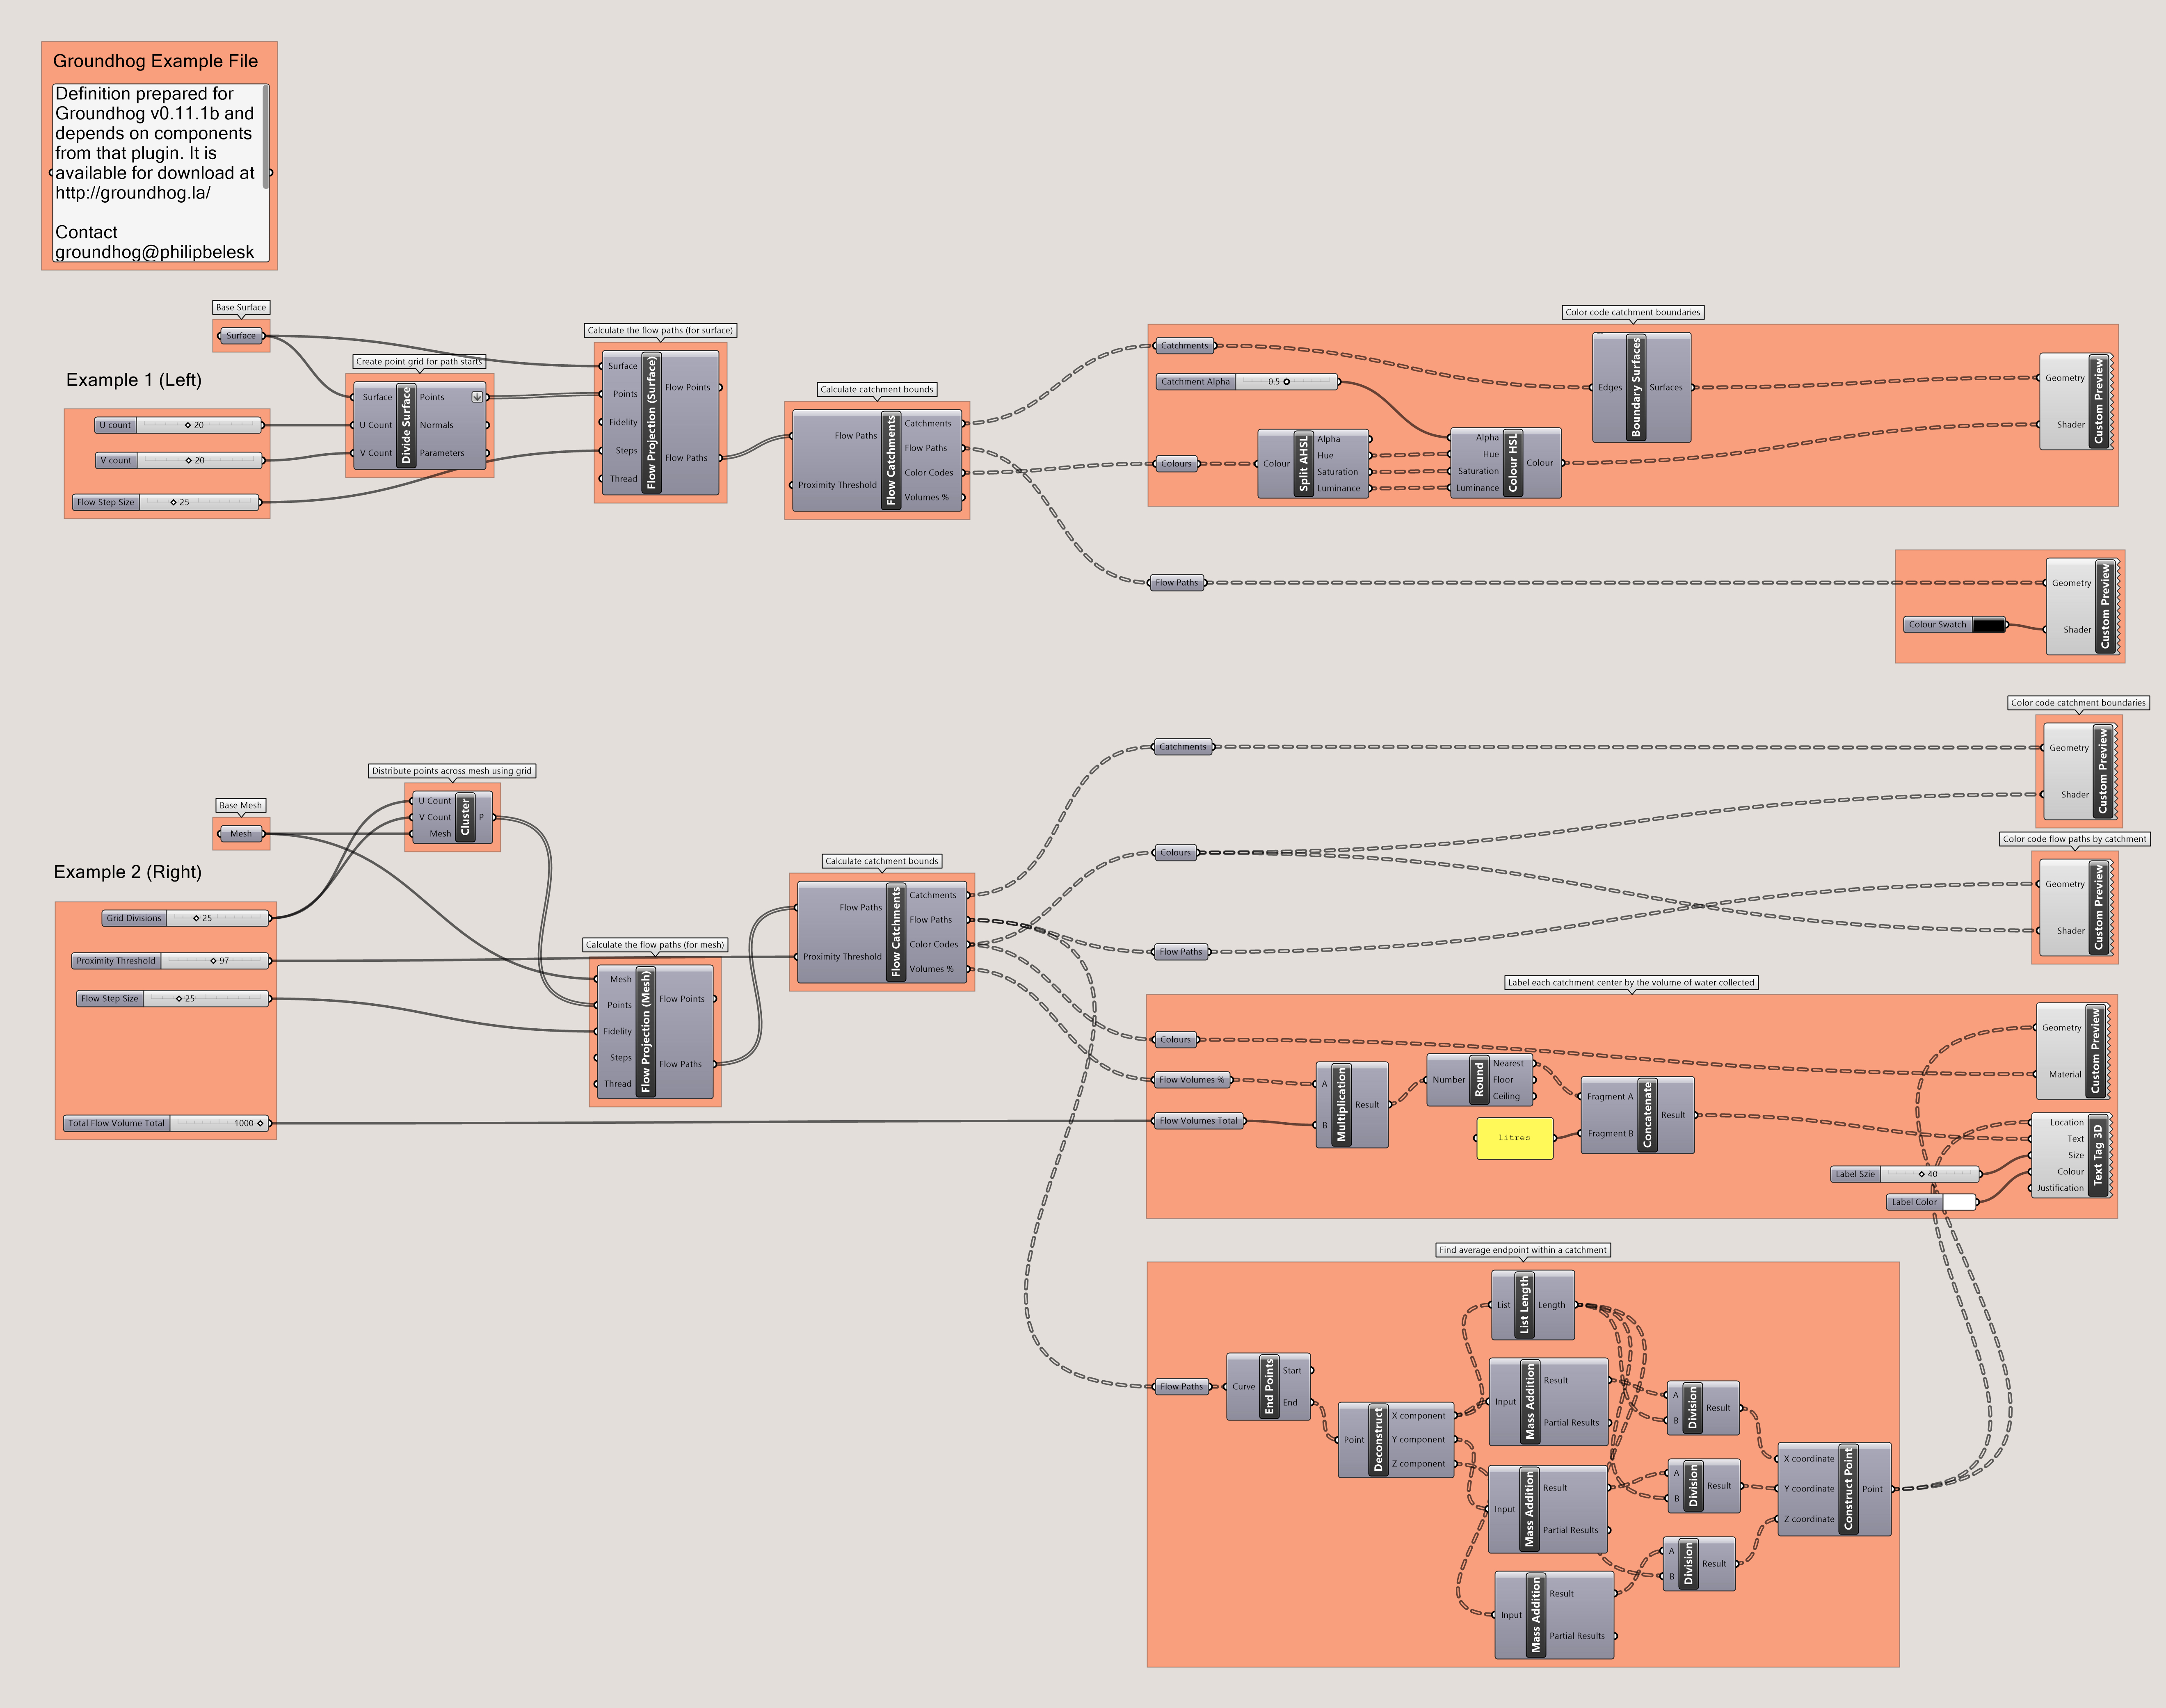
Grasshopper definition demonstrating how to use and extend the catchment analysis for Surface and Mesh forms.
Philip Belesky, for https://groundhog.philipbelesky.com